Posts
Classifying Viral Media
I think every one of us has been captivated by some type of viral post on social media; whether it was a video, a meme, or a photo that ‘broke the internet’. This phenomena of virality has a cult following of influencers, celebrities, and corporations attempting to quickly capitalize on growing trends and maintaining the ever-constant struggle to remain relevant. Each and every cultist has their own special formula for how to copy a viral post: restaging with their brand, adding their own sense of humor, or simply reposting, but how do they identify which posts are viral and which aren’t?
Virality (adj): The propensity of a digital object to be so widely well known that it becomes (even temporarily) a topic of public attention as a result from epidemic-like growth through social media. E.g. whether something can be considered to have gone “viral”
Social media platforms such as Twitter and Instagram have high level overviews of trending topics, but unless your focus is solely on the beneficiaries of the Justin Bieber problem, your community is likely smaller in scope or even limited to immediate followers. Thus, those global trending topics are much less useful in identifying viral media. So the question remains:
How can I identify which posts are viral?
While this is a meaningful question in and of itself, it is also the necessary starting point to further analyses. Having an accurate representation of our objective variable is essential, as any model can only be good as the data put into it. If I had unlimited time and resources, I could scour through a large copus and flag which data are viral and which aren’t. If I wanted to be quicker (yet less accurate), I could pick a heuristic boundary based on how the data is distributed or use a "common" threshold. But as data scientists, I think we can do better.
What we have here is an unsupervised learning problem: there is a bunch of data that needs to have a label applied to each row. The good news is that the outcome is binary (viral and nonviral), which should make the task easier. The bad news: there are imbalanced group sizes and differing densities. When looking into different algorithms that I could use, I stumbled across a clustering algorithm that had a sense of boundaries and outliers: DBSCAN.
DBSCAN stands for Density-Based Spatial Clustering of Applications with Noise. While not discussed frequently, DBSCAN won the algorithm test of time award. It is both intuitive to understand and incredibly flexible and fully deterministic. It is a non-parametric algorithm, meaning it does not make an assumption about the form of the mapping function, and thus it is free to learn any functional form from the training data. The algorithm takes two inputs (and a third indirect parameter) :
- ε (Eps): The distance from each point p which to search
- minpts: The minimum number of points which must be within the distance ε
- (Indirect) The function used to calculate distance
DBSCAN outputs the following labels:
- Class assignment - In our case a normal post or a viral post
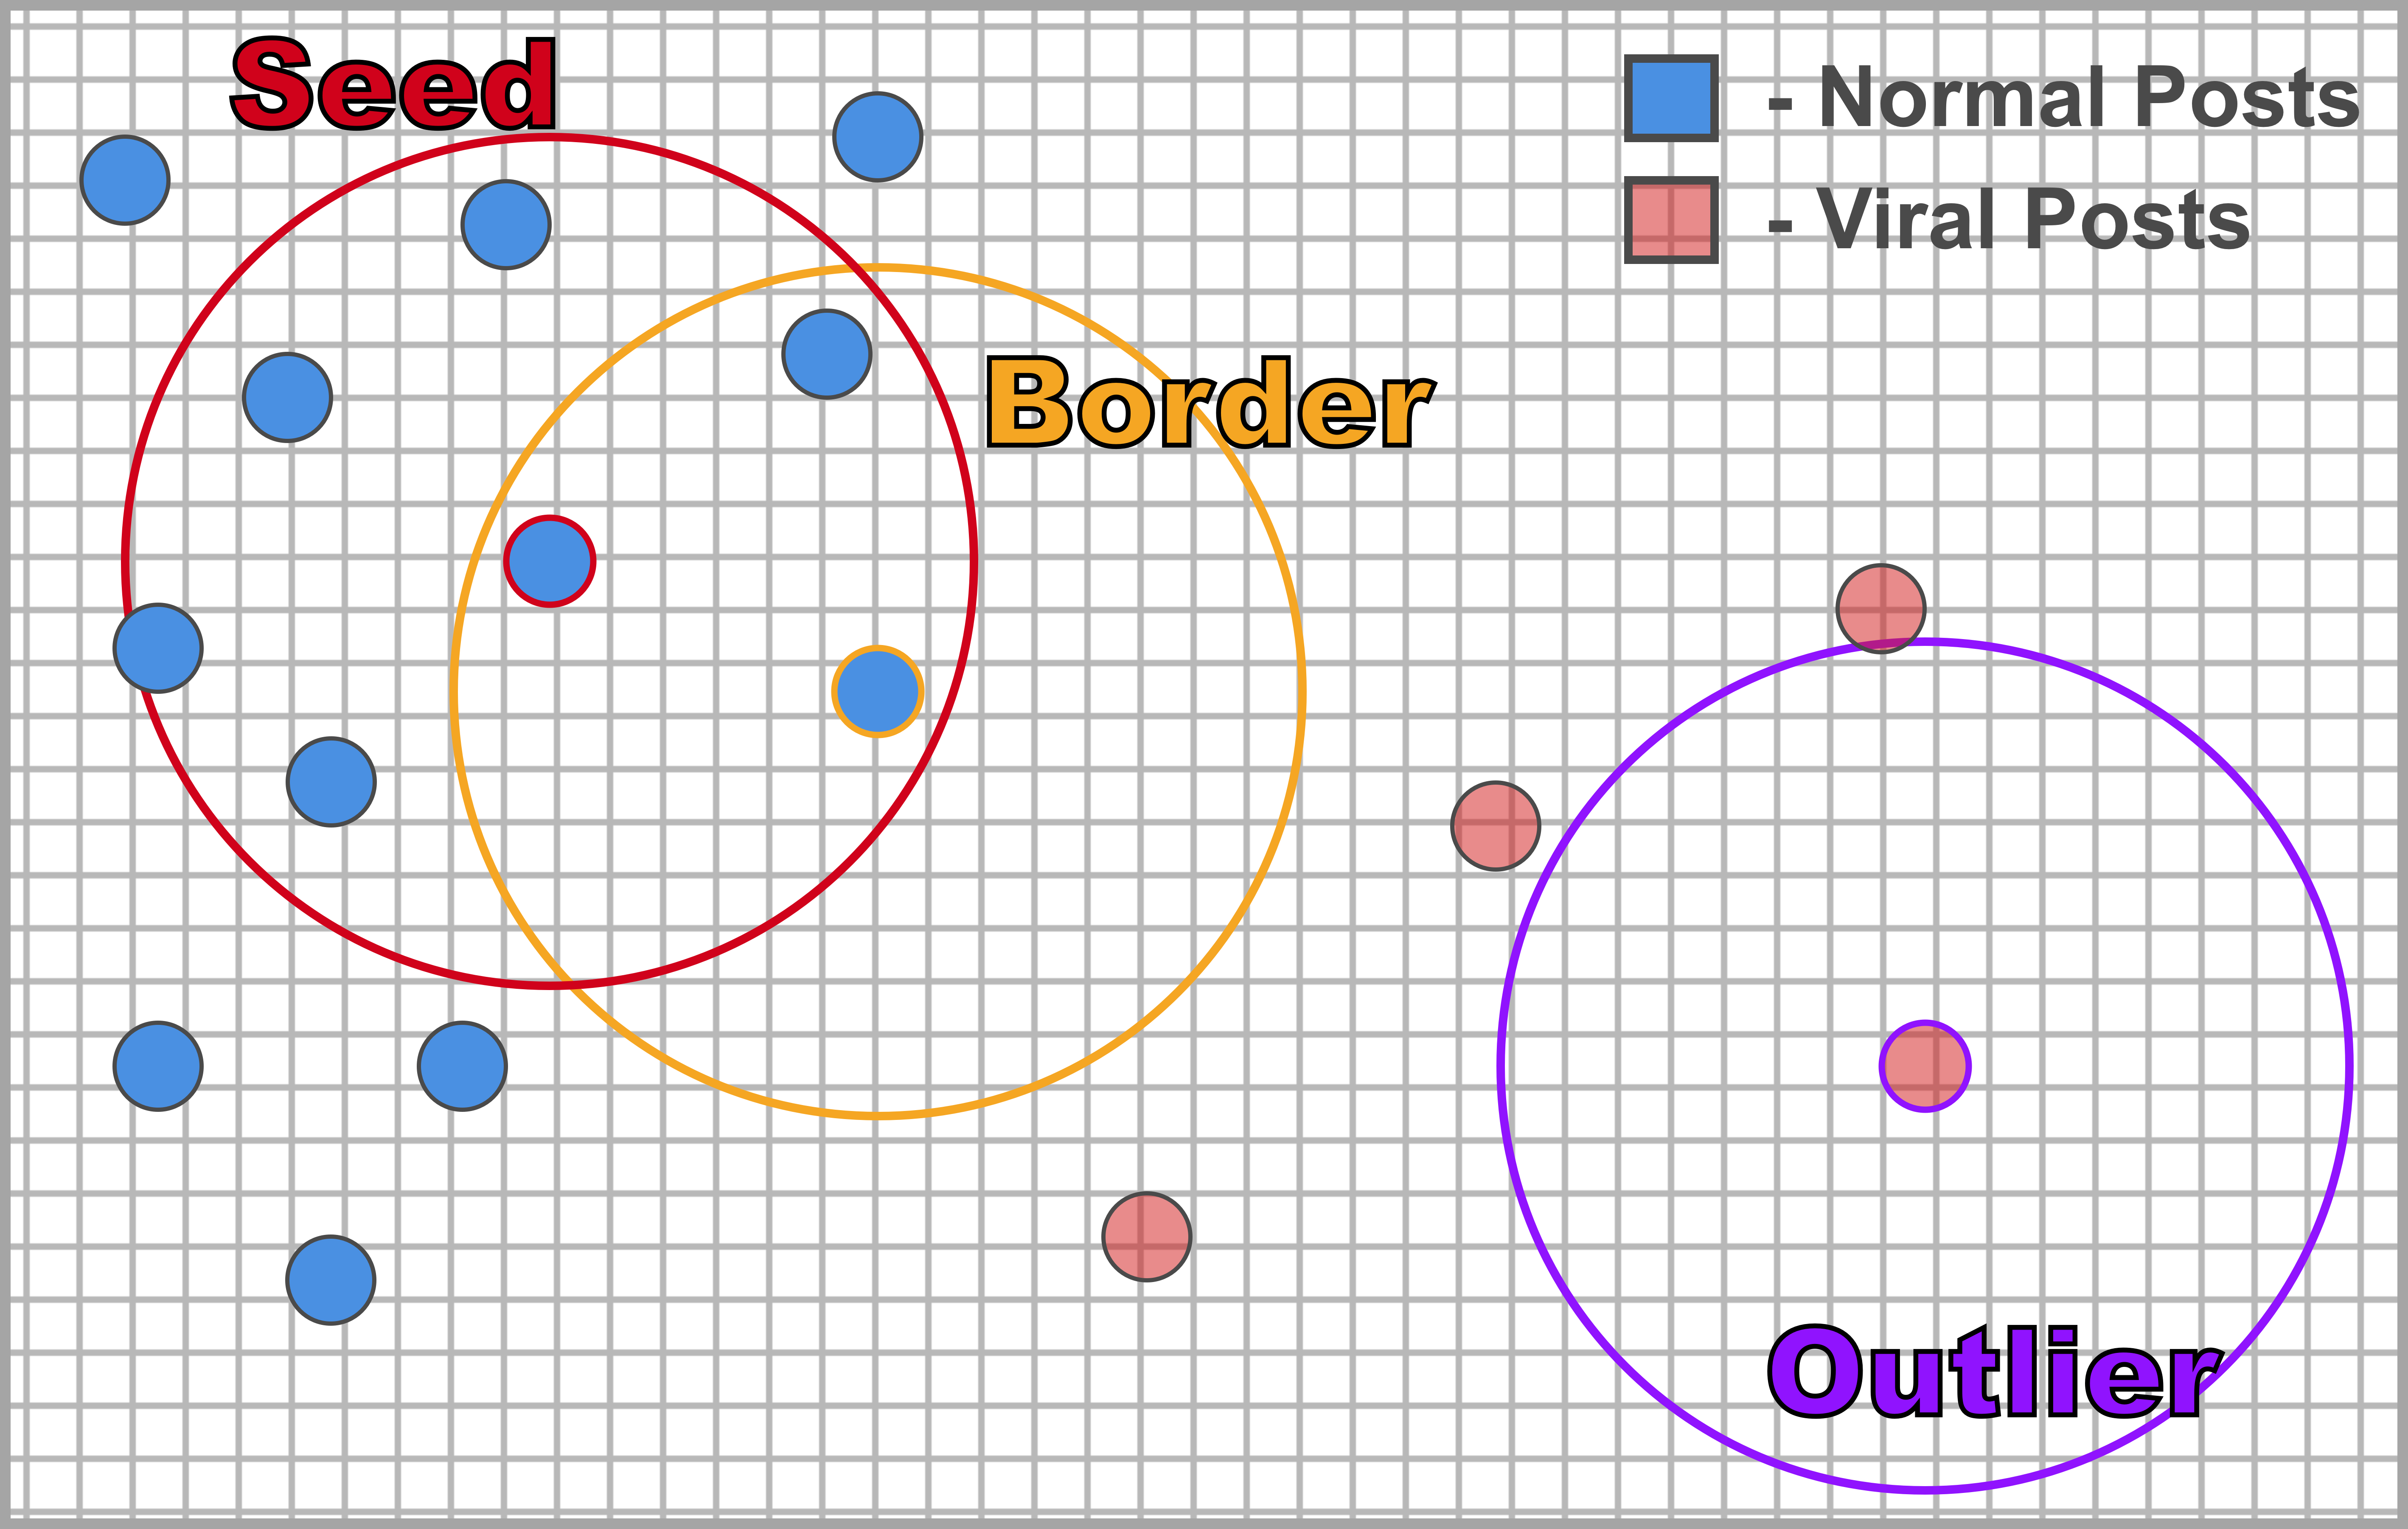
- Point type: Seed, Border, or Outlier

The algorithm starts at a random point in the dataset. The point’s eps(ε)-neighborhood is retrieved, and if it contains sufficiently many points, a cluster is started and the point is labeled as a seed. If a point is found to be a dense part of a cluster, its ε-neighborhood is also part of that cluster. Hence, all points that are found within the ε-neighborhood are added, as is their own ε-neighborhood if and when they are also dense. This process continues until the density-connected cluster is completely found. If a point’s ε-neighborhood does not contain sufficiently many points, the point is labeled as an outlier or noise. Note that this point may be later be labeled as part of a cluster if found in a sufficiently sized ε-environment of a different point and hence be made part of a cluster. In this scenario, the point is labeled as a border point.
The issue here, as can be seen in the graphic, is that due to the difference in density between the two groups, the algorithm fails to identify viral posts as their own cluster, but as outliers. Well what we know as outliers tend to have a lot in common with the characteristics we’ve identified about viral posts: they are relatively rare in occurrence and are typified by extreme values of engagement. So what if we tuned the algorithm to identify a single cluster? Each point identified as a cluster could be considered a non-viral post, outliers could be considered viral posts, and by constructing a convex shell from our border points, we can identify the threshold between normal and viral posts.
I’ll be walking through the code and the optimization function for this issue in an update / future post!
More Content Coming Soon!


